


Codegiant Launches Built-in Grafana Integration

We are excited to announce the launch of our built-in Grafana integration for advanced data visualization and monitoring in Codegiant!
Why Grafana?
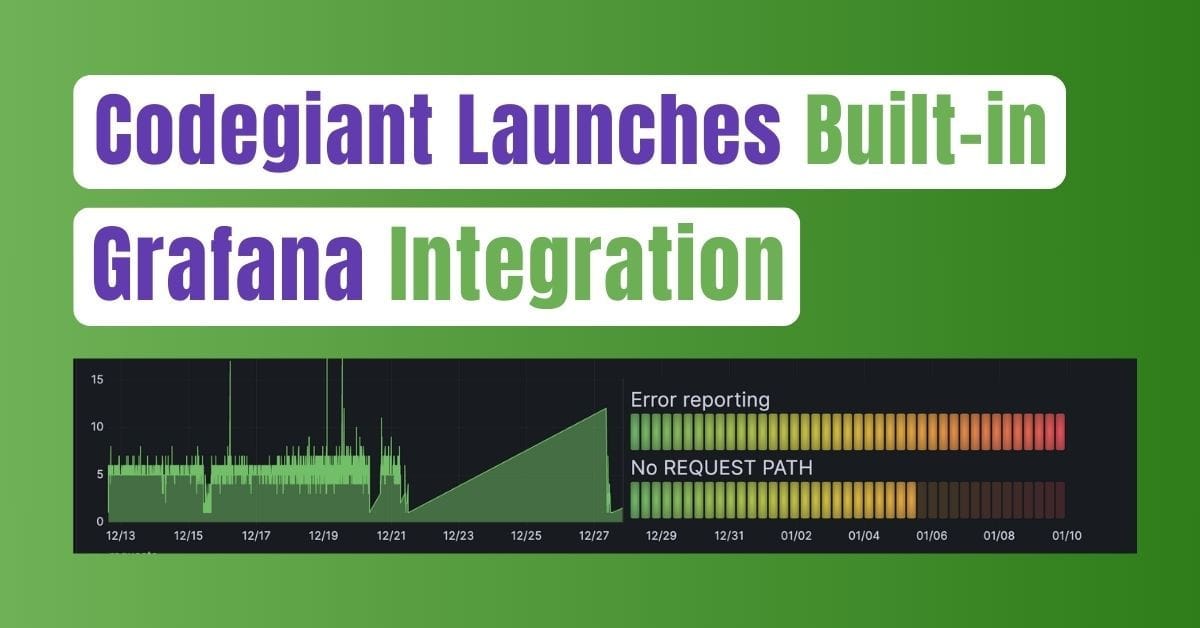
Grafana is a leading open-source platform for monitoring and observability. With its robust data visualization capabilities, Grafana helps turn your data into interactive dashboards. This integration means you can now visualize and track every aspect of your software development lifecycle directly within Codegiant.
What This Means for You
Enhanced Monitoring & Visualization: Create dynamic dashboards to monitor your development processes, including CI/CD pipelines, issue resolution, and application performance.
Informed Decision-Making: Leverage real-time data for quicker and more informed decisions, helping you streamline your development workflow.
Customizable Dashboards: Tailor Grafana dashboards to your team's specific needs, focusing on the metrics that matter the most to your projects.
Enhanced Collaboration: Foster better communication and collaboration among team members with a shared view of project metrics and progress.
Getting Started
To start using Grafana dashboards in Codegiant, log in to your Codegiant account and navigate to any of your existing Observability, Chaos Engineering, or Error and APM Tracing workspaces. You can also create a new workspace if you don't have one already.
When you open your workspace, you’ll see a new icon labeled “Dashboards”. Here’s what it looks like from an Error and APM Tracing workspace:

Clicking the “Dashboards” icon will open the dashboards view. Its left sidebar contains the options; “Playlists”, “Snapshots”, “Library panels”, and “Public dashboards”.

Playlists: This feature allows you to create a rotation of dashboards. It's useful for displaying a sequence of dashboards on a big screen.
Snapshots: Snapshots are shareable versions of a dashboard at a specific point in time. These are useful for sharing data with users who don't have access to your Codegiant workspace.
Library Panels: These are reusable dashboard elements. They allow you to create and maintain panels that can be shared across multiple dashboards.
Public Dashboards: This refers to dashboards that have been made publicly accessible, meaning they can be viewed without requiring authentication. This is also useful for sharing information with users who don’t have access to your Codegiant workspace.
Creating A New Grafana Dashboard
To create a new Grafana dashboard, click the “New” button on the top right of the “Dashboards” view, then select “New dashboard”. You should see a new view that looks like this:

You have the option of importing a dashboard from file or grafana.com, adding a library panel or adding a new visualization.
Adding A Visualization
To add a new visualization, click the “Add visualization” button, select data source; “Clickhouse”, for example.

You should then see a page that looks like this:

This is where you can customize your visualization and add custom queries using either the SQL Editor or Query Builder. You can also choose the type of visualization you want by clicking the “Change visualization” option on the right. “Table” is selected by default.

With this, you can create custom dashboards for monitoring various metrics and logs within your development environment. For example, here’s a dashboard that shows a pie chart detailing the proportion of errors across different devices, a bar chart showing the total count of errors by IP address, and a visualization listing specific errors with a color-coded severity level:

Conclusion
Our new Grafana integration equips you with the tools to transform data into actionable insights directly within Codegiant. For a detailed guide on how to fully utilize our dashboards feature, check out the Reports and Dashboards section of the Error & APM Tracing help center, as well as Chaos Engineering, and Observability.
This feature is available in the Codegiant freemium plan, so you can get started right away by clicking this link. As always, we look forward to hearing your feedback, and seeing how you utilize this new feature in your projects. Please leave a comment below. Cheers!