


How to Collect, Transform, and Ship Logs from OpenTelemetry to Codegiant Observability Using Vector


In modern software development, understanding the behavior of applications and detecting potential issues are paramount. This understanding is largely facilitated by effective log management practices. Logs provide valuable insights into the execution of software systems, enabling developers and operations teams to diagnose problems, monitor performance, and enhance overall reliability.
Vector is an open-source project that offers a comprehensive solution for collecting, transforming, and routing logs efficiently. With its lightweight architecture and versatile capabilities, Vector has become a preferred choice for many organizations seeking to streamline their observability pipelines. While OpenTelemetry is an observability framework simplifying the collection, processing, and exportation of telemetry data, including logs, from within applications through its software development kits (SDKs). Codegiant Observability on the other hand, is a centralized log management solution designed to collect data from any source, live tail logs, and perform real-time analysis. Unlike traditional log management solutions, Codegiant Observability offers a cost-effective and efficient alternative to tools like the Elastic Stack, Datadog and others.
In this blog post, we aim to demonstrate the integration between OpenTelemetry, Vector, and Codegiant Observability. We'll illustrate how to leverage these tools to collect, transform, and ship logs effectively, providing a comprehensive solution for monitoring and analyzing application behavior.
Prerequisites:
Before diving into the implementation, ensure you have the following prerequisites in place:
Codegiant Account: Sign up for a Codegiant account if you don't have one already. Codegiant Observability serves as the destination for our logs, providing advanced analytics and visualization capabilities.
Code Editor: Use your preferred code editor, whether it's a local IDE or a cloud-based solution like Codegiant Codepods.
Vector Installation: Install Vector on your local machine. The Vector project lives at https://github.com/vectordotdev/vector.
The Vector's Architecture
Vector operates on the principle of collecting, transforming, and forwarding telemetry data efficiently, making it a powerful tool in the realm of log management. At its core, Vector collects data from various sources, leveraging its transformation language, the Vector Remap Language (VRL), to manipulate log entries as necessary. Following the transformation stage, Vector processes log messages and forwards them to designated storage or queue systems for further analysis. This architecture provides users with flexibility and scalability in managing logs across diverse environments.
Now that we have a good understanding of the architecture and prerequisites, let's dive into the implementation of log collection using OpenTelemetry and Vector. To demonstrate the integration, we'll create a simple Flask application that logs messages and generates trace data. But before that, let's get our Vector running.
Create a configuration file for Vector, named vector.yaml, with the following setup:
sources:
  codegiant_py-ot:
    type: opentelemetry
    grpc:
      address: "0.0.0.0:4317"
    http:
      address: "0.0.0.0:4318"

sinks:
  my_sink_id:
    type: console
    inputs:
      - "codegiant_py-ot.logs"
    encoding:
codec: jsonThis configuration initializes an OpenTelemetry source, defining where Vector should listen for incoming logs. In this case, it sets up both gRPC and HTTP endpoints. The output, or "sink," directs the log data to the console. Later, we'll update this configuration to add another sink for sending logs to Codegiant Observability.
Once you've created the configuration file, start Vector by running the following command, replacing vector.yaml with the path to your actual configuration file:
$ vector --config vector.toml
Now, let's create a Flask application integrated with OpenTelemetry for logging. Follow these steps:
Virtual Environment Setup: First, set up a virtual environment (venv) to manage dependencies and isolate your project environment. Run the following commands:
$ python3 -m venv .venv
$ source .venv/bin/activate   # On macOS and Linux
$ .venv\Scripts\activate      # On Windows
Application Code: Create a file named
app.pyto store your Flask application code. Below is a basic example of how you can set up your Flask application for logging:
import logging
from flask import Flask, jsonify

from opentelemetry import trace
from opentelemetry._logs import set_logger_provider
from opentelemetry.exporter.otlp.proto.grpc._log_exporter import OTLPLogExporter
from opentelemetry.sdk._logs import LoggerProvider, LoggingHandler
from opentelemetry.sdk._logs.export import BatchLogRecordProcessor
from opentelemetry.sdk.resources import Resource
from opentelemetry.sdk.trace import TracerProvider
from opentelemetry.sdk.trace.export import (
    BatchSpanProcessor,
    ConsoleSpanExporter,
)

# Initialize Flask app
app = Flask(__name__)


# SET THIS TO YOUR OTLP COLLECTOR ADDRESS AND PORT
OTLP_COLLECTOR = "0.0.0.0:4317"

# Initialize OpenTelemetry components
trace.set_tracer_provider(TracerProvider())
trace.get_tracer_provider().add_span_processor(
    BatchSpanProcessor(ConsoleSpanExporter())
)

logger_provider = LoggerProvider(
    resource=Resource.create(
        {
            "service.name": "otel-python-test",
            "service.instance.id": "instance-01",
        }
    ),
)
set_logger_provider(logger_provider)

exporter = OTLPLogExporter(insecure=True, endpoint=OTLP_COLLECTOR)
logger_provider.add_log_record_processor(BatchLogRecordProcessor(exporter))

# Set the logging level to decide what levels get sent to Vector
handler = LoggingHandler(level=logging.NOTSET, logger_provider=logger_provider)

# Attach OTLP handler to root logger
logging.getLogger().addHandler(handler)


# Define Flask routes
@app.route('/')
def index():
    return "Welcome to the OpenTelemetry Flask API!"


@app.route('/log', methods=['GET'])
def log_message():
    # Log message
    logging.warning("This is a warning log message.")
    logging.error("This is an error log message.")
    return "Log message sent."

@app.route('/trace', methods=['GET'])
def trace_message():
    # Trace message
    tracer = trace.get_tracer(__name__)
    with tracer.start_as_current_span("foo"):
        logging.error("This is an error log message with trace context.")
    return "Trace message sent."

if __name__ == '__main__':
app.run(host='0.0.0.0', port=5000)To generate the requirements.txt file containing the necessary Python dependencies, run the following command in your terminal:
$ pip freeze > requirements.txtBefore adding the Codegiant sink, you can test the Flask application to ensure that logs are visible in the console where the Vector process is running.
Adding Codegiant Sink
Sign in to your Codegiant account, navigate to the workspace section, and follow these steps:
Click on the plus icon to create a new item, selecting "Observability."
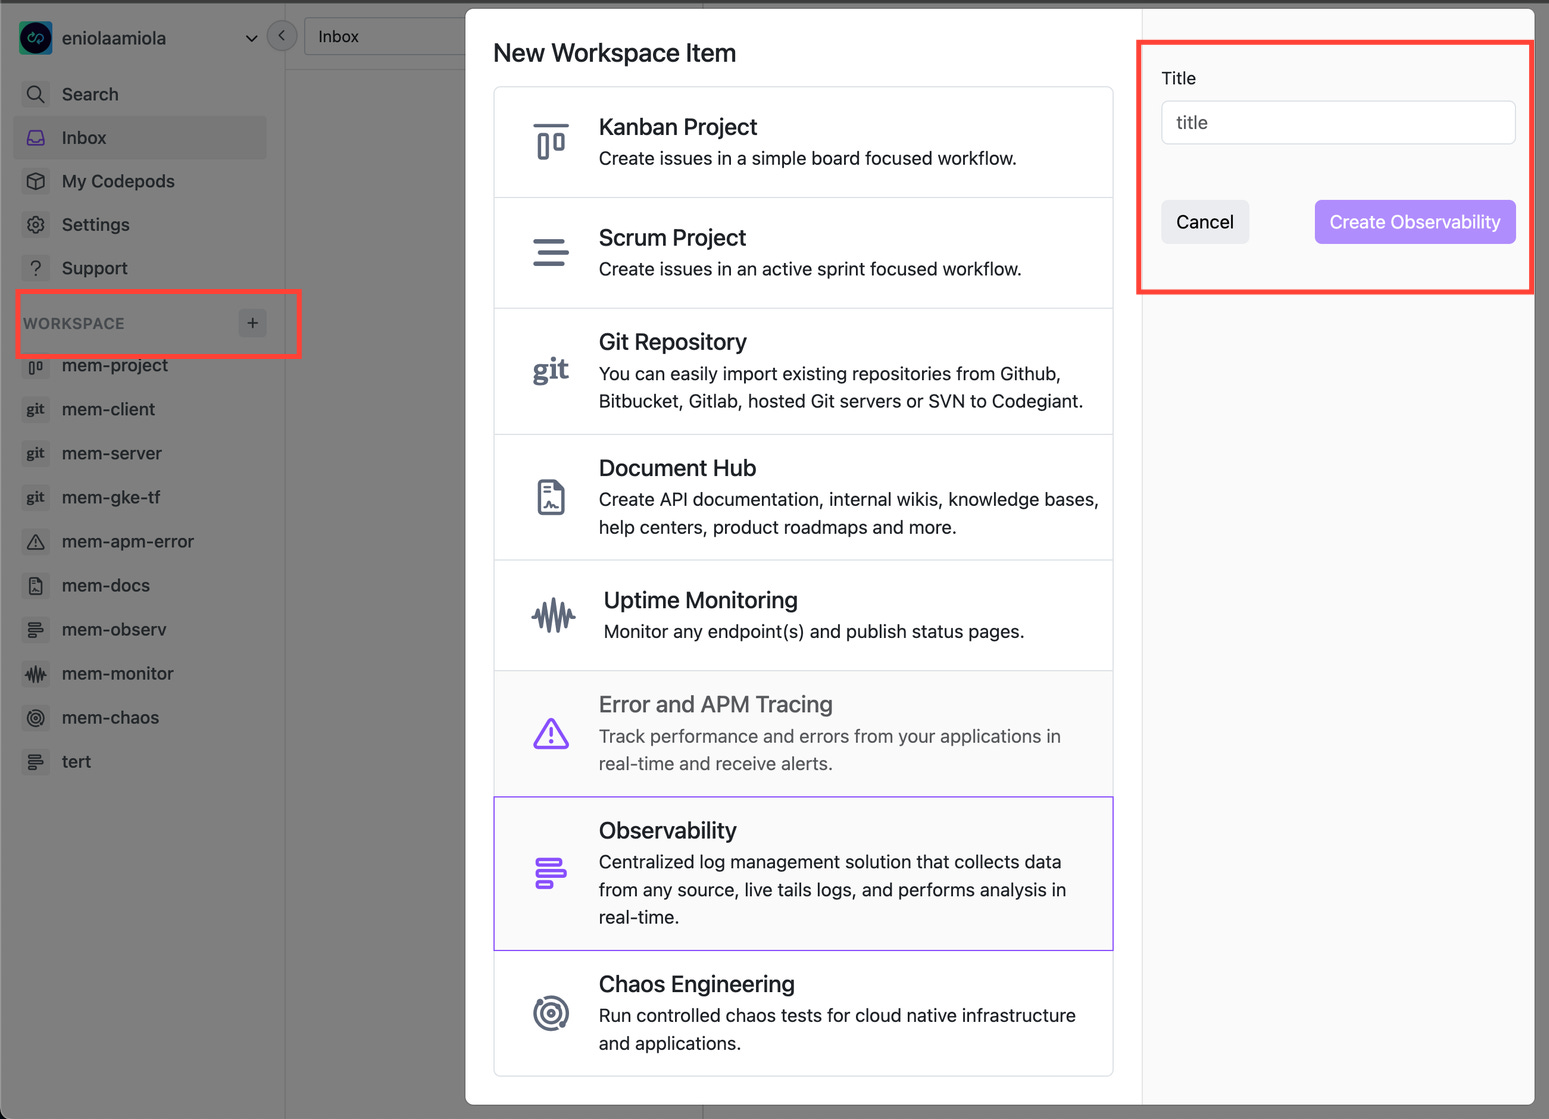
Provide a title for your observability item and click on "Create Observability."
Within the created observability item, click on "Add Source" to add a new source for log collection, choosing Opentelemetry.
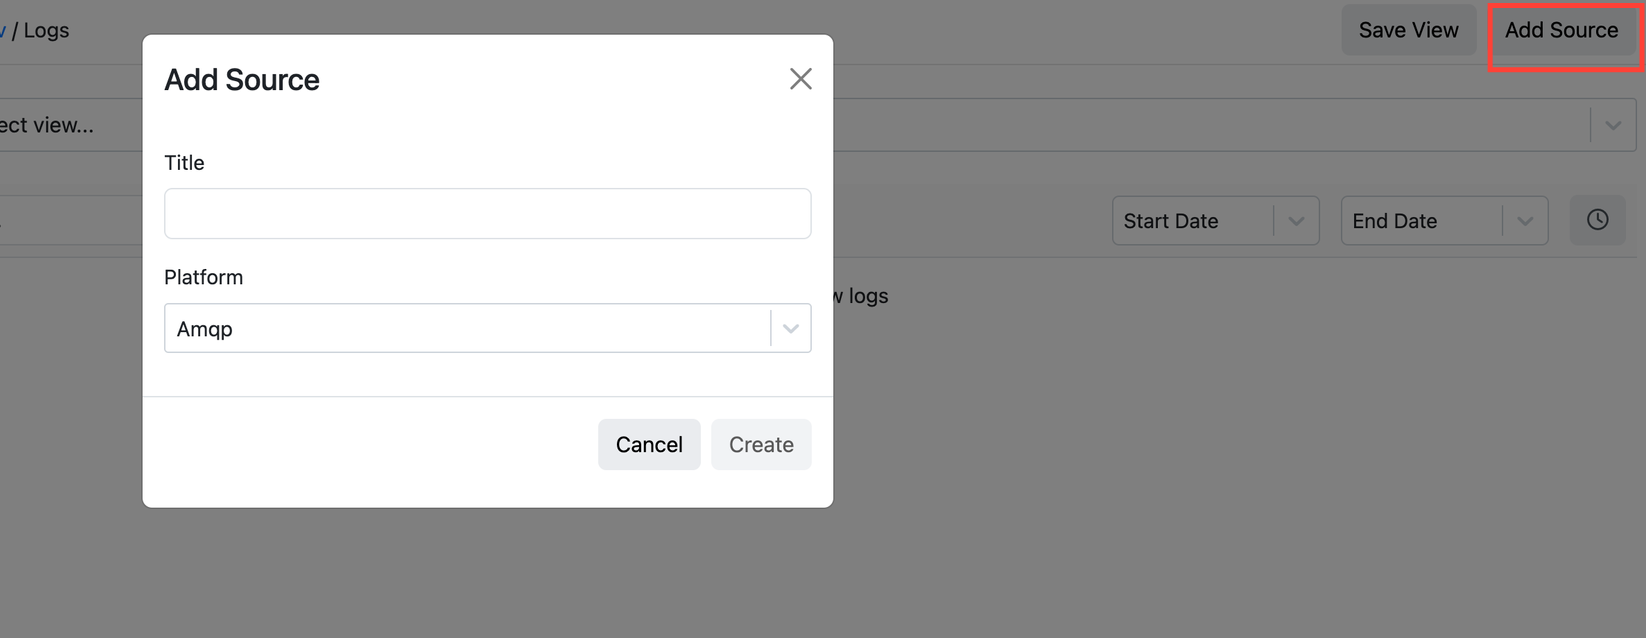
Upon adding the source, you'll receive a unique token required for sending data to Codegiant Observability. Additionally, you'll access a sample Vector configuration in TOML format.
Copy the provided Vector configuration and tailor it to your requirements. Rewrite the configuration in YAML format and integrate it into the existing Vector configuration file. In my case, I have a setup similar to the following:
...

  codegiant_http_sink_py-ot:
    type: http
    inputs:
      - "codegiant_py-ot.logs"
    uri: "https://log.codegiant.io"
    method: post
    compression: none
    auth:
      strategy: bearer
      token: "<TOKEN>"
    encoding: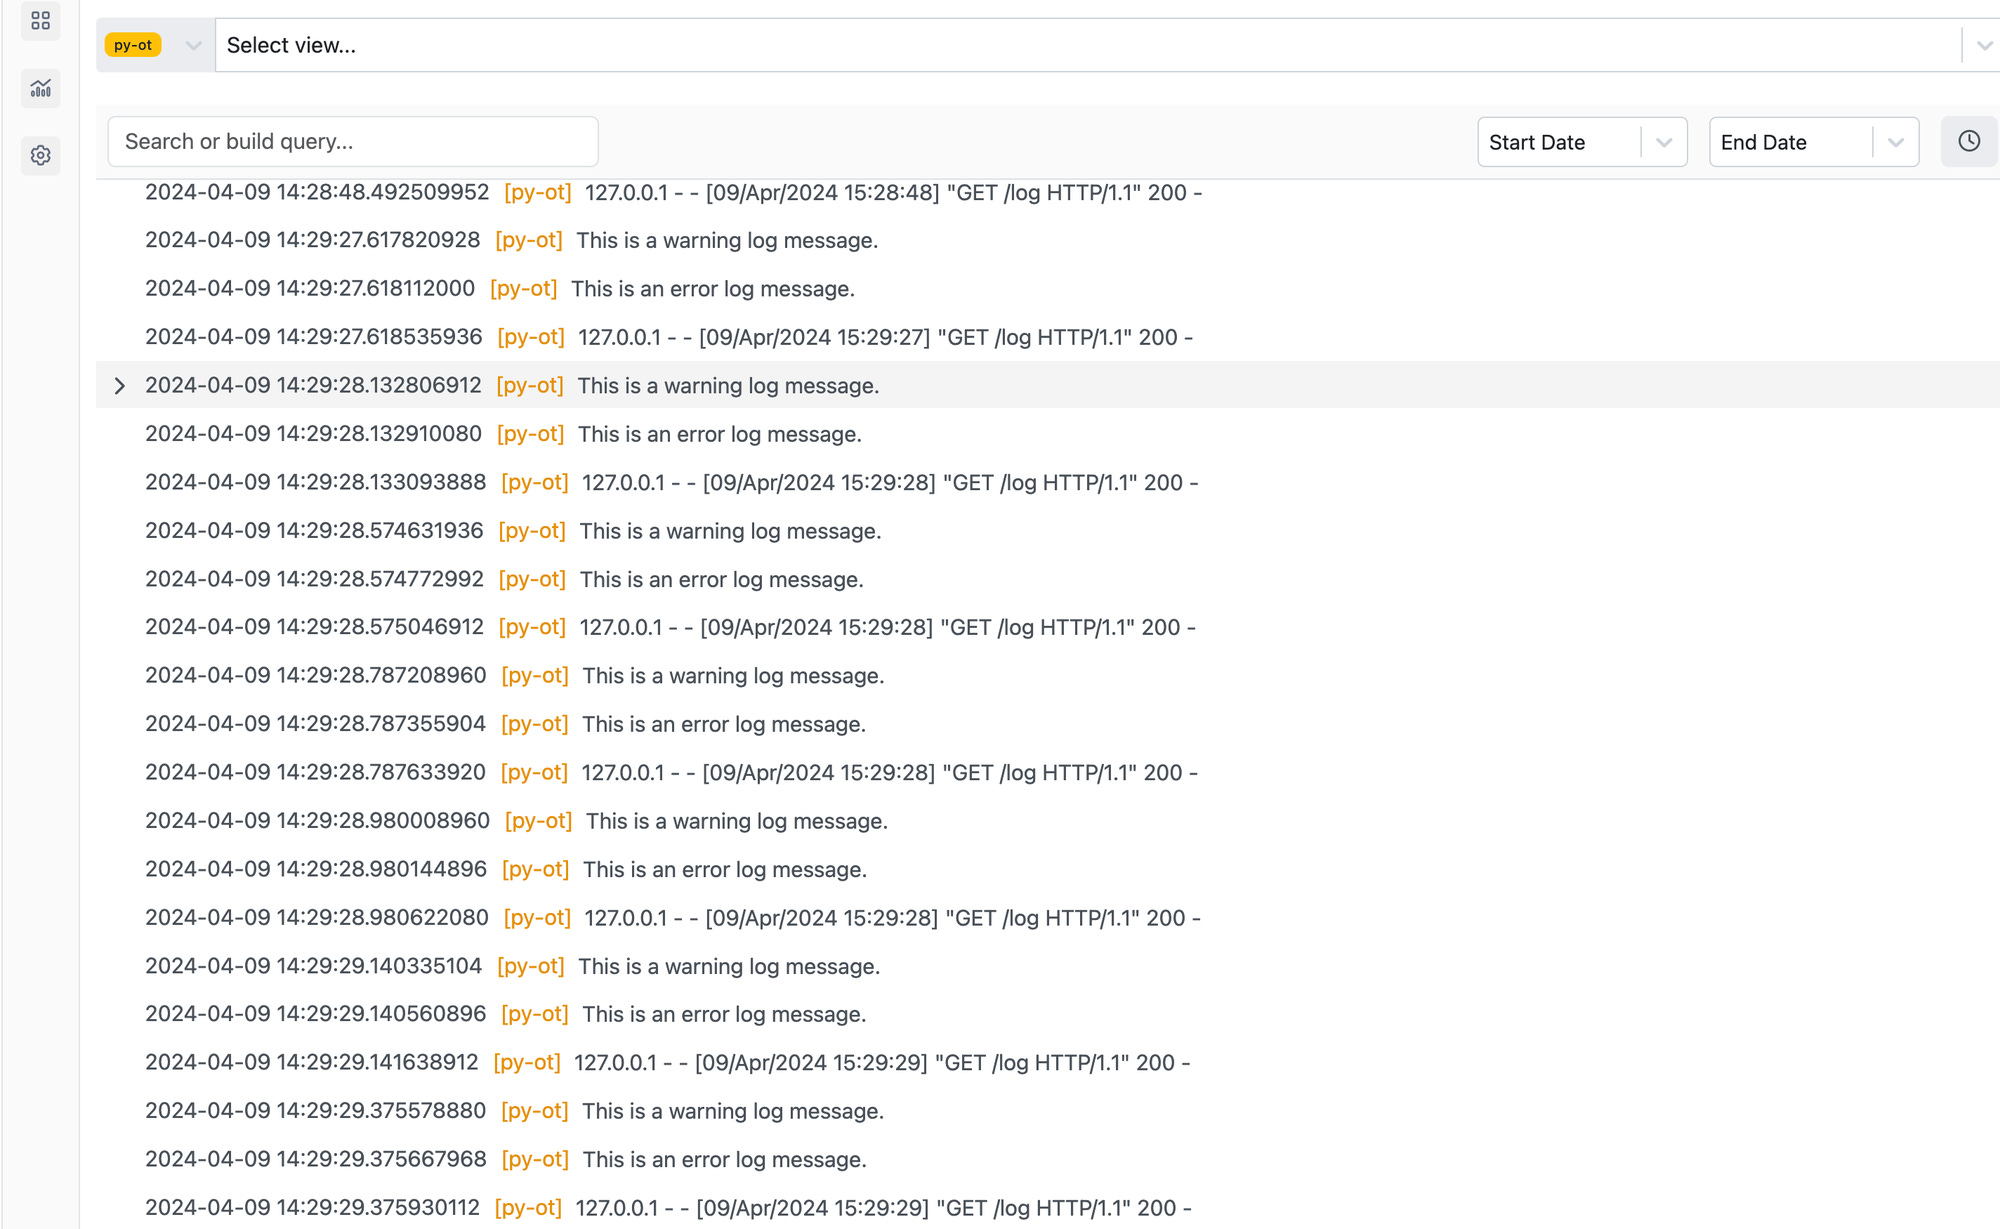
codec: jsonStop the Vector process and start it again with the updated configuration. Access your Flask application on localhost:5000/logs to generate log messages. Refresh a couple of times to ensure sufficient logs. Then, visit Codegiant to witness the logs streaming in.
Conclusion
Throughout this tutorial, we've covered how to set up Vector and developed a Flask application integrated with OpenTelemetry for logging. We've also explored how to customize Vector's configuration to include a Codegiant HTTP sink, enabling integration with Codegiant Observability.
With logs successfully streaming into Codegiant Observability, you've laid a solid foundation for effective log management and analysis. As you explore further, consider customizing dashboards, setting up alerts, and leveraging Codegiant's analytical and visualization tools to derive valuable insights from your log data.